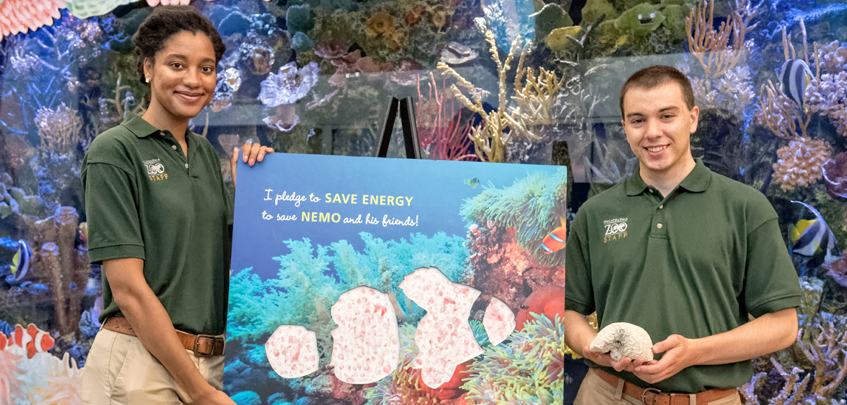
The recruitment phase of the Philadelphia Zoo’s “Saving Energy to Save Wildlife” project concluded at the end of 2016 with impressive results. Drawing from NNOCCI framing methods, guests were engaged with Zoo interpreters through a short hands-on activity showing the effects that ocean acidification has on marine ecosystems, as well as how saving energy at home can benefit organisms in the ocean. We asked adults to take part in a study to track their household energy usage, which would allow us to understand if our on-site messaging was encouraging behavior change after their visit. Midway through 2017 we received the energy usage data from our partners and set out to find out if our goal was being achieved.
Setting up for Analysis
Our partners PECO Energy and Opower-Oracle provided us with information necessary to analyze the impact that our messaging could have on guests. To truly understand if Zoo guests were saving more energy than average after their visit, we needed to establish a baseline. Opower provided the energy usage for each study participant and their “comparable counterpart household”, which is a household containing similar square footage, heating systems, and number of individuals living in the home, so a one-to-one comparison could be made. The more variables we were able to control for, the greater chance a difference in energy usage could be attributed to the Zoo visit.
While 165 guests agreed to take part in the energy tracking study, only 64 guests could be matched with a viable comparable counterpart household. Therefore, only 39% guests who were recruited are included in the analysis.
Study Results
The energy usage analysis was conducted by comparing total kWh / day usage of all Zoo guests against all comparable counterparts. Average daily energy usage was calculated on a rolling basis – participants were recruited over a six-month period, so energy usage for each individual was pulled from billing cycles that began within a 180-day period after their recruitment.
Throughout the duration of the study, Zoo guests used an average of 30.2 kWh/day of electricity, while non-visitors used 31.0 kWh/day. This results in Zoo visitors using 2.87% less electricity than non-visitors, on the whole.
| January 2016 – December 2016 |
N = 64 households |
|
| Zoo Visitors | Comparable Counterparts | Percentage Difference |
| 30.2 kWh / day | 31.0 kWh / day | -2.87% |
To assess the precision of our result, we calculated the difference in average daily energy usage between each individual study participant and their comparable household. The closer we looked at the data, the cloudier the results became. An individual Zoo guest’s usage could have ranged from anywhere from 94% higher to 95% lower than their comparable household. Standard deviation calculation confirmed that the differences between samples were extremely high.
Due to such high deviation, in addition to the overall lack of statistical significance as a result of small population size, we still cannot confidently conclude that on-site messaging resulted in off-site behavior change. However, the enthusiasm and willingness of our guests to take part in such a large study is extremely encouraging, and reaffirms the idea that Zoo guests are conservation-minded and want to utilize zoos and aquariums as vehicles to take action for wildlife and the environment. As we look ahead to the next iteration of this project, there are a few steps we can take to ensure we truly capture the whole impact our on-site messaging has on our guests.
Next Steps
The most important next step is to increase the number of study participants recruited. We need approximately 1000 households for statistically significant results. Considering that 645 adults were asked to take part in the study during the entire recruiting process, the return of 64 usable households resulted in a 10% success rate. Assuming that rate holds consistent as the project expands; approximately 10,000 adults would need to be asked to take part in the study to reach the 1000 household threshold. We are currently exploring alternative recruitment methods that we hope will yield higher results. Other actions we are considering include:
- Expanding eligibility so guests who are not PECO Energy customers may participate
- Working with partners to provide a higher return rate of comparable counterpart households
- Incorporating follow-up communication to study participants to remind them they are still making an impact on the environment
We are currently discussing the next phase of the data collection and are strongly considering working with a Zoo affinity group such as members. The first phase of this project has produced encouraging results and we are looking forward in the next phase.